 Eliza Gniadek
created
edited
Reading campaign reports in FreshMail
Back to list of articlesEmail campaigns aren’t just about creating a newsletter and getting it out to a subscriber list. The feedback you get from every campaign is a crucial part of your ability to fine tune the settings for your next one.
This is why you should spend the time to get familiar with campaign reports. The insights they provide about your subscribers contributes to the increased efficiency of your next message. Being able to understand campaign reports and use the data they contain will directly impact your bottom line.
So let’s go right to how to read campaign reports in FreshMail. If you’re already familiar with the basics, you can skip straight to the second part of this post - Benefits from campaign analysis.
Reading campaign reports in FreshMail
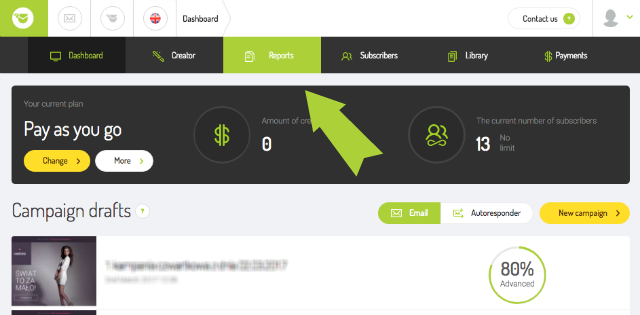
Campaign reports are found in the Reports tab on the main menu or under the individual campaigns in your account.
After clicking on the campaign you want to see the results for, you will see a summary of the most important parameters along with a menu of options on the left that will provide more detailed statistics, divided into several categories. Let’s go through them step by step.
Snapshot
This is where you can get the overall results of your campaigns, including things like the number of emails sent and delivered. Subscriber activities are easily seen on pie charts, showing what percent clicked on a link (CTR), how many of your messages were opened (Open Rate) and the number of resignations from your mailing list. All data is also available in absolute terms rather than percentages, including unique opens. This is useful for knowing which subscribers return to your messages and which read only once.
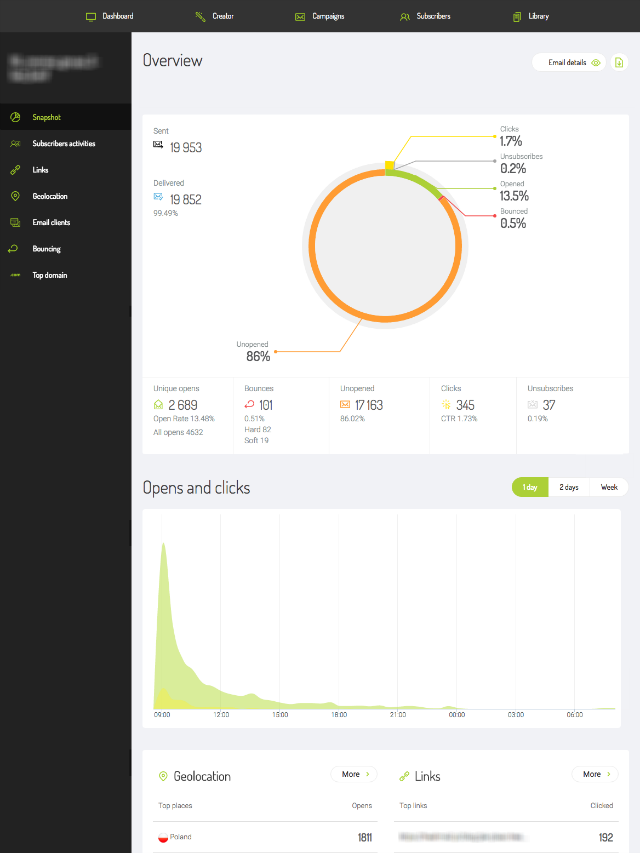
This is also where you can find information about message bounces, divided into soft (due to temporary issues with deliverability) and hard (the impossibility of delivering a message because, for example, the address does not exist). This data tells you a lot about the quality of your subscriber list and problems associated with deliverability.
Learn more about getting the most out of your FreshMail account:
- Awesome FreshMail Features That You Probably Didn’t Know About – Part 1
- Awesome FreshMail Features That You Probably Didn’t Know About – Part 2
The next piece of useful information you get here is the hour and the day when when most of your subscribers interact with your mails. This can help you to plan your next campaign and optimise your sending time. Mails are typically opened till a few hours after being sent but you can best select the time for sending your campaigns after running a Sending Time Optimizer.
Campaign reports can also give you geolocation information along with data on the most-opened links in your newsletters. Details on these reports can be found in the corresponding tabs on the left-hand menu. More about these later.
Subscriber activities
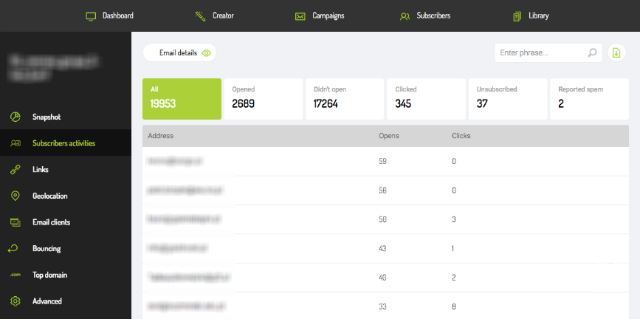
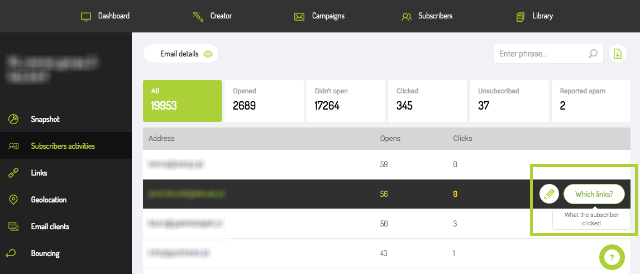
Moving on to the next tab, you’ll find detailed information about how particular subscribers reacted to your message:
- How many and which subscribers opened your message
- How many and which subscribers did not open your message
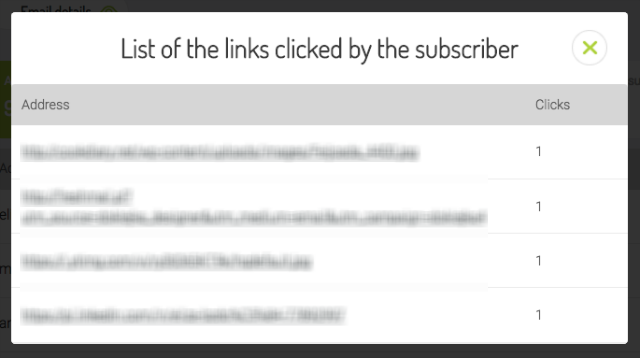
- The number of subscribers who clicked on a link, how many times they clicked and what they clicked on
- Who resigned from your mailing list
- Who reported your messages as spam
Clicking on a particular address will display that user’s activity history:
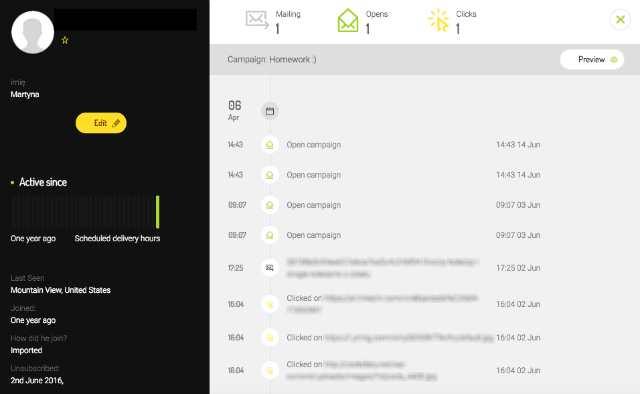
This feature allows you to get a feel for how strongly subscribers are engaged with your message. You won’t know what, if any, changes to make until you dive into this data.
If you mouse over an address, you’ll get a quick view of that user’s click history. This is how easy it is to judge subscriber engagement!
Links
Opening this tab, you will learn details about which links were most popular among your subscribers in a given campaign. Colour-based charts show information about CTR, including unique clicks. The most-clicked links will display below.
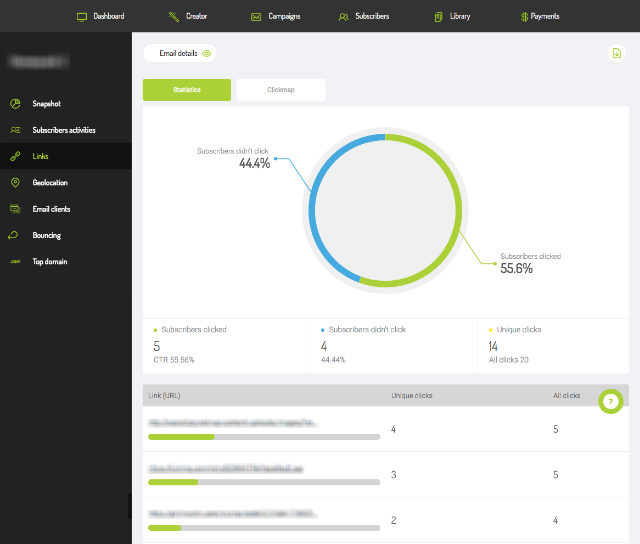
Mousing over a link will show which subscribers clicked on it.

Apart from these stats, you also have access to a click map with a visual representation of which links got the most attention from your subscribers. This is useful for determining whether or not your CTA is clear and compelling and if your overall message is convincing enough.
Geolocation
The next piece of useful data you gain from campaign reports is geolocation.
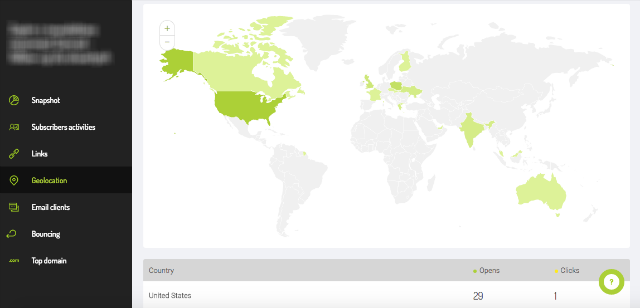
This can be very useful for region or location-based promotion. It’s another to target particular groups of subscribers through segmentation.
Be careful - not all data from geolocation can be applied to other marketing activities. Limitations on the accuracy IP include Gmail addresses registering as being in California and most mobile users being recorded as located wherever their mobile service provider is based.
Email clients
Knowing what programs your subscribers use for email and what devices they view messages on is key to optimising your newsletter design. This information has a strong influence on how you design your message for mobile devices, how much text you use for certain programs, like Outlook.
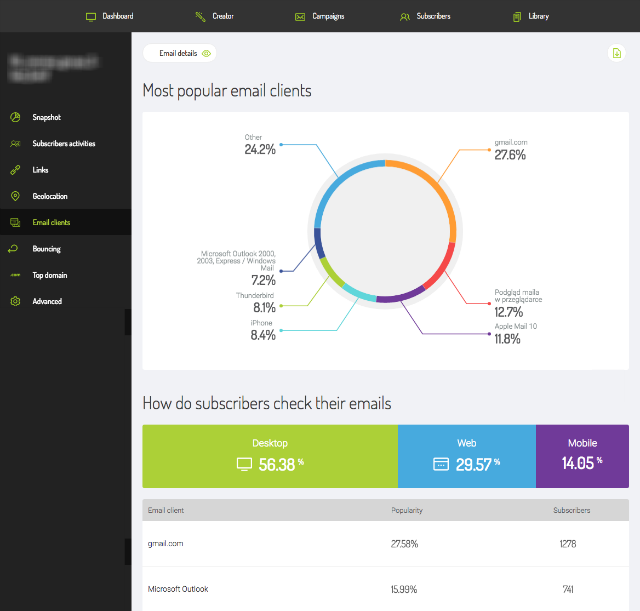
Knowing what email service providers your subscribers use also informs decisions about the length of your subject line and designing your message to avoid spam filters.
Bouncing
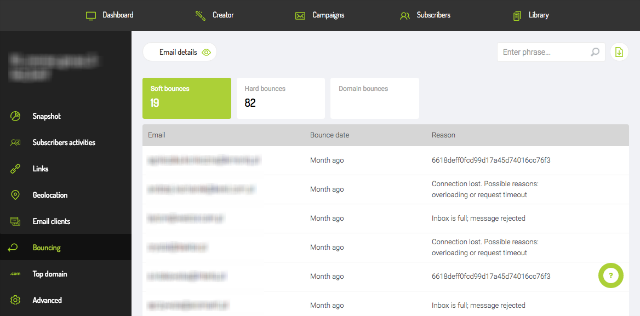
This is pretty straightforward - this tab tells you all about how many of your messages bounced and what kind of bounces they were (soft bounces, hard bounces) as well as which domains the bounces occurred in. This is useful for being able to contact domain admins regarding resolving such issues.
Top domain
Knowing the most common domains among your subscribers lets you design your message with the technical specifications of that domain in mind. Analysing the behaviour of subscribers in a particular domain can help to make future campaigns more effective.
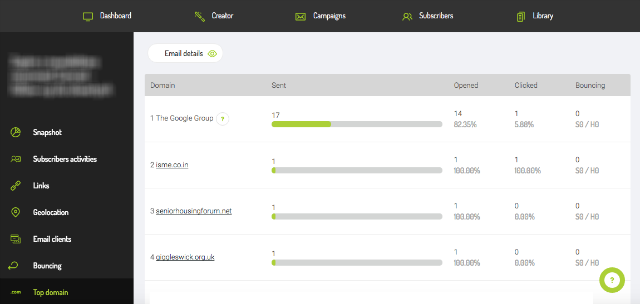
These stats let you see the relationship between a domain and how active its subscribers are.
But that’s not all...
There’s more useful information that you can use to make your campaigns more effective in the Subscribers tab. You can learn about the quality of your mailing list and details about devices used to open your mails, where they are opened and what links are clicked on most often.
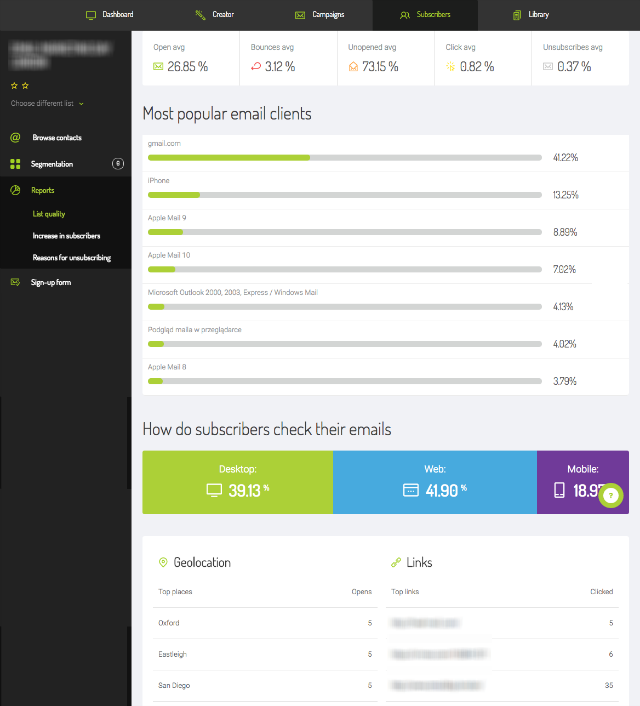
The next important metric in the analysis of your email campaigns is the growth in the number of subscribers. Your reports will tell you how many new addresses have joined your mailing list and how many have resigned, giving you the chance to quickly react if the numbers head in the wrong direction.

The feedback you get from former subscribers can alert you to issues that need to be addressed and fixed in order to avoid further losses.
Benefits from campaign analysis
As you can see, campaign reports supply you with lots of data about every aspect of your email marketing campaigns but now we turn to the matter of what to do with all of it. Properly applying the information you get is the key to getting even better results next time. Let’s take a look at specific improvements you can make.
Learn more about mailing list quality
An up-to-date subscriber list is the foundation of a successful email marketing campaign. Inactive addresses will only cause bounces and bring down your campaign statistics.
Using the double opt-in model is the first step towards ensuring a high-quality subscriber list. This is part of good email marketing practices (based on permission marketing) and protects also you against bots and non-existent email addresses.
A mailing list cleansed of non-performing addresses not only converts better but maintains your reputation as a sender, which in turn promotes the deliverability of your messages.
React faster when there’s a problem
Your campaign reports can reveal problems you weren’t aware of and give you chance to make needed corrections before the problem gets bigger. Whether it’s the content of your message or the kind of segmentation you are using, getting an alert to potential problems can help to avoid disappointing campaign results.
If you want to know why your recipients leave your newsletter, you should analyse the number of unsubscribing and their reasons.
If you get complaints about sending too many messages, you can reduce the frequency of your emails or put a limit on the number a given subscriber can receive. Just go to the “How often do you want to send messages to your subscribers” option in the settings of the Contact tab.
If you see that there are an unusually high number of clicks on a preview link, it could be a sign that you may need to use an Inbox Test to verify that your message is displaying properly in certain domains. It could be that images are not downloaded automatically or the message is broken into pieces.
An alarm should sound whenever someone reports your messages as spam. This is a sign that your content or your message frequency is not what some subscribers expected.
Learn the best time to send campaigns
Analysing the exact times that your messages get opened tell you a lot about when is the best time to send you campaign. Sending at the wrong time can result in your message being lost in a flood of other messages or deleted as part of a daily “cleaning” of inboxes.
Opening time charts also show you if your recipients react immediately to your messages or if they wait until a few hours later. Each bit of information about subscriber behaviour helps you to better identify the time when you are likely to get the best reaction from them.
Find out if your content is engaging and if you are trusted as a sender
Before you can make a conversion, you need subscribers to open your mail. Your Open Rate is the first signal that tells you how effective your message title is and whether or not it entices subscribers to click on it.
The name used in the sender field is equally important. It has to be credible and familiar to subscribers so they can open the message with confidence and examine its contents.
Learn more about the preferences of subscribers to better shape your content to their expectations
Knowing what your subscribers expect to receive from you is another key to email marketing success. This applies to every subscriber at a personal level and the more personalised your content is, the better your conversions will be.
Every link your subscribers click on and every mail they reopen is a small bit of information that helps to create a more accurate picture of their collective preferences. For more precise information, you can add tags to your links to get even more data about subscriber behaviour.
By analysing top link report, you’ll find out, which links are the most popular among all subscribers. Try to distinguish them. Take a look at the click map and check where they’re placed. The click map will show you where is the best place to put your CTA.
Learn more about the devices your subscribers use and adapt your templates to match them
When putting your newsletter template together, bear in mind that different devices can display your message in different ways. Thanks to campaign reports (and Email Applications in particular), you can see what percent of your mails are opened on various devices, in different browsers and on desktops.
If a large portion of your subscribers open your messages on a desktop program like Outlook, it’s better to design simple, even text-only, messages without complicated formatting since these programs often have trouble properly displaying more intricate designs. Also, certain functionalities like GIFs don’t display as moving images in some applications and so including them can only distract from your message.
If your subscribers open their mail in a browser, you can add this data to information you have about common domains among your subscribers. This will help you to design your newsletter to conform with the technical specifications of particular programs and optimise things like the length of your subject line and preheader.
If the majority of your subscribers use a mobile application to read your messages, it’s better to focus on making your newsletter fully responsive with a simple design and prominent CTA button. Small CTAs are too hard to click on for smartphones users and complicated designs can be hard to read.
See if your template is user-friendly and your CTA stands out
Most of your subscribers will scan your message rather than read it in detail. If nothing gets their attention, they will move on to other things and your chance for conversion disappears. This is why having a clearly arranged template with a visible CTA is a basic part of email marketing success.
Click maps can show just where subscriber attention is focused. Matching it with stats from your CTA can help you design your template with everything in just the right place.
Find out where your subscribers are
This is very useful information if, in addition to email marketing, you have physical sales locations or if you have to target subscribers in a particular area for a local event. By giving you information about the physical location of subscribers, campaign reports let you create appropriate segments as needed.
You’ll learn more about subscriber behaviour
Learning about subscriber behaviour is the key to getting better results from your campaigns. Learn how they react to your emails, how often they open your messages, which links they click on - everything is shown on a timeline. Just click on an email address to see its entire behavioural history. If, for example, lots of your subscribers read your messages but don't click on the links, you should consider changing your template or adding a CTA that stand out from the crowd.
Campaign reports are more just results
Constant monitoring of campaign reports is a fundamental part of successful email marketing. The information you gather about subscriber reaction to your campaigns is more than just a measure of the results, it’s the basis for improvements and corrections that will make your next campaign even better.
Having all of this data in one place makes it that much easier to apply it to your next design or strategy.
Integrating FreshMail with Google Analytics and a CRM will give you even more valuable data about your subscribers and their behaviour on your site, including their purchase histories. This in turn lets you better personalise your offer and boost conversions and get the best ROI possible.

