 Renata Gajoch-Bielecka
created
The most important email marketing KPIs that you should follow (but probably don’t…)
Back to list of articlesA third of marketers don’t know which online channels bring them the most revenue. On top of that, Marketing Sherpa tells us that most email marketers monitor just three statistics from their email campaigns: open rate (OR), click through rate (CTR) and deliverability.
Do you think that’s enough to run really effective email marketing campaigns and to improve the results you get? Well, it isn’t. Take a look and see why and learn more about the most important email marketing KPIs the best marketers follow when they’re working their magic!

See also: Are your CTR's high enought?
Why you should keep an eye on campaign stats
As Dan Zarella says:
“marketing without data is like driving a car with your eyes closed.”
Not only do you not know where you’re going, you can’t learn from mistakes that you make. This is not the best way to go if you want to run your email campaigns in the most effective way possible.
Following campaign results in real time gives you lots of valuable information that lets you measure how engaged your subscribers are with your message.
You get hard data that you can use to support your argument for more investment in email marketing or to demonstrate its results to others.
Also, knowing where you want to go (in your “car”, as Dan says) means being able to use your campaign stats to see how close you are to staying on the right path and avoiding mistakes that waste time and money.
Long-term campaign idicators
Long-term indicators are used to measure how well you are keeping up with big-picture goals set by your company.
Among others, they can be:
- Increasing traffic on your website,
- Building brand image,
- Driving sales.
It’s important to know what you want to accomplish with your campaigns and not lose sight of it in your day-to-day work.
That’s how you’re able to know what to optimise in order to reach your goals. If you don’t know what you want - for example, a 10% rise in sales in a given time period - you won’t be sure what you achieved and if it’s a good result.
Long-term email marketing campaign indicators include:
Conversions
Conversions are the percentage of subscribers who fulfilled a goal after clicking on a link. It could be:
- Making a purchase,
- Signing up for a webinar,
- Downloading a report,
- Downloading an application,
- Completing a survey.
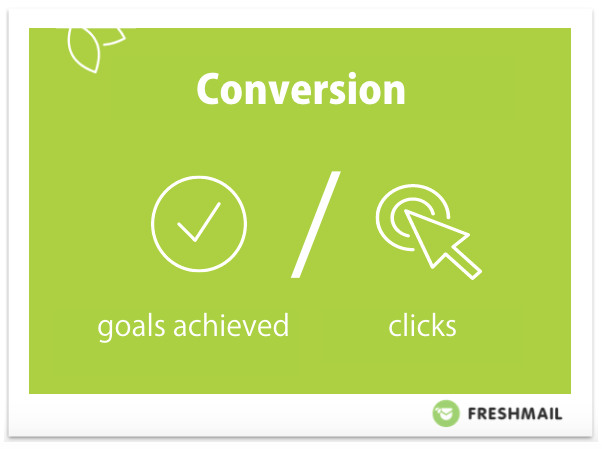
We can refer to the conversion rate of a particular campaign as well as the general conversion rates of all your campaigns together.
How to determine your conversion rate
Conversions are expressed as a percentage, calculated as the number of subscribers who completed a goal as a portion of everyone who went to a certain page or clicked on a link contained in an email.
How to analyse your conversion rate
In a perfect world, your conversion rate would be 100%, meaning that everyone who clicked on a link in your campaign went on to complete whatever goal you set.
In this world, however, you have to concentrate on getting a conversion rate that’s high enough to get the results you need, whether that be in sales or some other objective.
ROI
If your mail email marketing goal is sales, you have to monitor your ROI, return on investment.
ROI is a measure of the effectiveness of your business and marketing activities. It tells you if you are making sound business decisions regarding the money invested.
Calculating your ROI
To determine the ROI from your email marketing, you first have to be aware of the total amount you have invested in it. Include resources allocated for use of an email marketing system and related costs like graphics or technical help.
ROI is expressed as a the relationship of return to invested resources as in the graphic below.
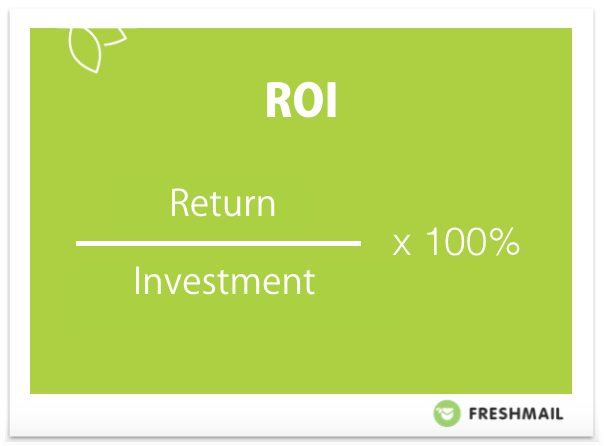
Analysing the return on your investment in email marketing
According to DMA, the average return on investment from email marketing is 3800%, meaning that for every dollar invested in campaigns, thirty-eight dollars come back.
As long as the costs involved in running your campaigns are lower than the returns you’re getting, you’re on the right path!
The rate of growth of your subscriber database
It’s just a fact of life that people are going to leave your mailing list for a variety of reasons no matter what you do. Even when you do everything right, subscribers will still decide that they don’t want your newsletter anymore.
Subscriber interests change. Sometimes they simple want to limit the number of emails they get every day in their inboxes.
As long as you’re adding more than you’re losing, your subscriber data is growing and that’s the most important thing.
Calculating the growth in your mailing list
To calculate the growth in your mailing list, add the number of subscribers that resigned from your mailing list together with the number of hard bounces that occurred. Subtract this amount from the number of subscribers who joined your mailing list during the same period and divide by the number of total subscribers on your list.
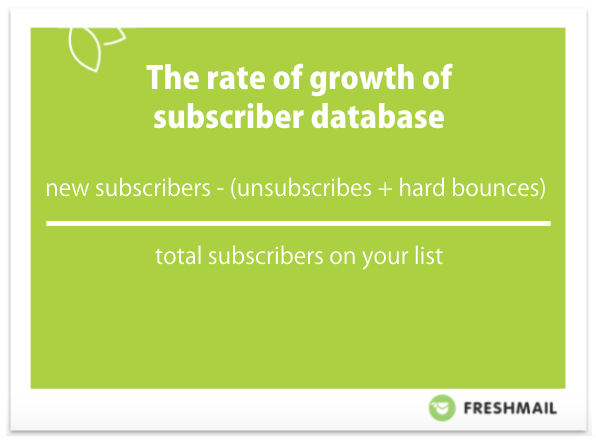
Analyzing the rate of growth in your mailing list
MarketingSherpa tells us that it’s natural for 25% of your newsletter subscribers to leave every year, especially if you have a small database to begin with.
That’s why it’s important maintain a steady increase in subscribers through use of a good newsletter signup form that attracts interest. If new subscribers are slow in coming or don’t show up at all, this is the first place you should look for answers.
You have other options for quickly attracting new subscribers, like through posting a newsletter signup form on your Facebook page or using a tablet at conferences, workshops, in stores and other touch points where customers can join.
Spreading your net as wide as possible will help to find the people who are interested in what you have to say.
Deliverability
This is a measurement that speaks directly to your reputation as a sender of messages, the quality of those messages and the status of your mailing list.
Gmail and other email service providers carefully monitor the reactions of message recipients that you send to. The more subscribers that label your message as spam, the lower your deliverability will be.
This is an effective system that helps to distinguish spammers from marketers that are operating according to the principles of permission marketing.
Remember, then, that if you send generic, non-personalized campaign to all of your subscribers there’s a good chance that many of them will not be interested and will mark your message as spam.
Also, if you don’t regularly monitor how many bouncing addresses are found on your subscriber list - usually those obtained illegally without use of the double opt-in model - you are endangering your reputation as a sender and thus jeopardizing your deliverability.
As a rule of thumb, you shouldn’t have more than about a 10% bounce rate in order keep your sender reputation intact.
How to calculate your deliverability
Deliverability is determined by calculating the number of delivered messages as a percent of all messages sent.
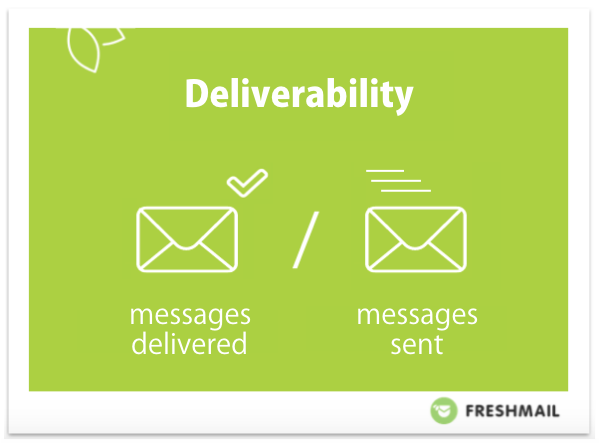
How to analyze deliverability rates
Follow your deliverability rates closely for sudden changes that can be a sign of larger problems with your email marketing activities.
Sometimes such problems are associated with a change in the form of your communications, its frequency or the kind of content you share with subscribers.
It can also be related to the settings of your domain and its reputation so make that the first place you go when it’s time to investigate a sudden decrease in your deliverability.
Statistics related to individual campaigns
What comes to mind if we’re talking about stats from particular email campaigns?
These are the two you probably think of:
- A totally inaccurate open rate that includes unread messages in Hotmail and doesn’t include messages that are opened but don’t download graphics in the mail,
- A more accurate CTR that gives you a better idea about the ability of your message to reach subscribers and convince them to go to a linked page in your mail.
Don’t misunderstand me - both indicators are very important for measuring the success of any campaign and give you a general feel for its effectiveness.
You should, however, look at them in the right way and correlate them with other factors. This gives you a broader view on the performance of your campaigns. Here are some tips for how to calculate: them:
But what about other important indicator that tell you more about the effectiveness of your email marketing campaigns?
Bounces
Messages that aren’t deliverable, or “bounces”, are noted in the campaign reports you get after your newsletter is sent.
Bounces are divided into two groups:
- Hard bounces, which happend when a message cannot be delivered because an address or server does not exist.
- Soft bounces, which are the result of temporary problems like a full inbox or system issues that are corrected at some point.
How to calculate the bounce rate
Unfortunately you are not able to calculate it on your own because you need data from email service provider servers. This is why the stats are only accessible through email marketing systems. It’s enough to check them after each campaign and then remove addresses that exceed a given number of bounces.
How to analyze your bounce rate
Your bounce rate tells you about the quality of your mailing list.
If your subscriber database was purchased or has been inactive for some time, your bounce rate will certainly be higher and will get the attention of anti-spam filters.
That’s why it’s very important to regularly manage bouncing addresses as they appear in order to maintain database hygiene.
A significant number of hard bounces has a negative influence on your reputation as a message sender.
UTOR
The number of unsubscribes in relation to the number of opened mails (Unsubscribe-To-Open Rate) shows how many subscribers decided to quit your mailing list after seeing what you have to offer.
How to calculate your UTOR
Start with an analysis of which subscribers opened your messages and then compare that with the list of addresses that resigned from your newsletter after a given campaign.
Remember that opens and resignations can appear days or even weeks after a campaign was sent - not everyone opens a messages or resigns right after a message is sent.
How to analyze your UTOR
A high UTOR should be a strong signal that something needs fixing.
Your message should be engaging and be adapted to the needs and interests of individual subscribers.
If your newsletter doesn’t meet these requirements, it opens the door to subscriber disengagement.
This is why it’s important not to use “spammy” terms and symbols in your mails in the style of commercial offers.
Such tricks might increase your open rate but that’s all. Instead of building lasting relationships with customers, you will make them feel cheated and they will start searching for the “resign from newsletter” link or mark the message as spam.

